Social Impact Calculator
A visual, holistic approach to cost-benefit analysis that examines the full social return of investments and policies.

Version 2.0 [October 2020]
Overview
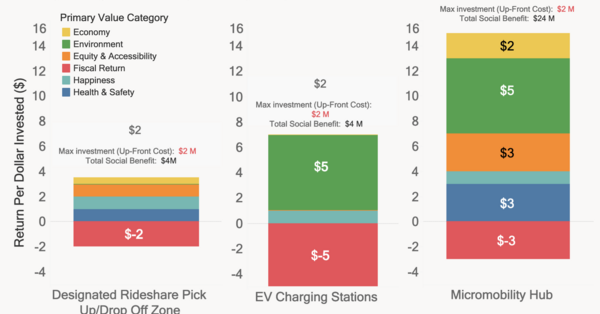
When it comes to looking at the holistic impact of an investment on the things we care about- quality of life, equity, the environment- traditional CBAs are woefully inadequate. The Social Impact Calculator is a visual tool that shows investment and return from both the government and public perspectives in a comprehensive way that aligns values and outcomes. The purpose is both to help decision-makers make smart long-term choices and to help communicate the reasoning behind such choices to residents. [1]
[1] Cityfi (2019). "Quantifying Social Costs and Benefits to Guide Individual Action". Medium.
Why use it?
The Social Benefit Calculator:
- Makes the invisible visible - The focus on naming and broadly estimating all significant social costs and benefits keep the decision-making process rooted in reality and attentive to typically overlooked and difficult to measure factors
- Has a flexible, open-source framework that allows staff and community members to make adjustments over time to take new information into account, as well as apply the framework to different policies and investments
- Uses a long-term time horizon (30 years for infrastructure, 10 years for add-on investments) to help guide smart decisions
- Maximizes community engagement and informed discussion through a simple, visual interface
Who is it for?
Policymakers, companies
How long does it take?
While the framework serves as a template, it takes time to fill in the specific impacts and estimated values that relate to your particular project. We recommend using round numbers for estimates in order to convey the large margin of error and communicate most simply to community members. We also recommend embracing subjective forecasts or adjustments to research from people with expertise within your organization. Logic and common sense are often more accurate than using "objective" proxy data. Still, you will need to gather those experts and other key stakeholders to decide on assumptions, talk through the range of impact values (we've used 0-30 to reflect 1 full return for each year of assumed lifespan), and finalize the numbers and visual. Plan for 3-6 months.
How many people is it for?
Flexible
What materials do you need?
The Social Impact Calculator is built in Tableau and uses Google Sheets as its database. Note that Tableau licenses may be provided to non-profits at no cost.
What does the facilitator need to know or be able to do?
It takes courage to put up numbers that include subjectivity. However, it is necessary if we are to include the meaningful impacts that are difficult to measure, and expert subjectivity is often more trustworthy than statistics taken from objective research (e.g. willingness-to-pay surveys). The facilitator needs to be able to communicate that the visual is meant to be a basis for discussion and evolve over time.
Expertise in Tableau or other data visualization and software is also helpful to make the tool as user friendly in its final form as possible.
Acknowledgements
Cityfi, Miami-Dade County Department of Public Works
Links
- Cityfi. Lawson, Chelsea et al (2019). "Miami-Dade Social Return on Investment Methodology."
- Policy Application - "The Social Cost of Cheap Corn."
- Investment Application 1 - "Scenario Comparison of Bus Express Rapid Transit in Miami-Dade County."
- Investment Application 2 - "Comparison of Mobility Hub Investments in Miami-Dade County."
- Google Sheets Template
Share
Share
-
Member

Thomas Brown
-
Member


Ole Kristian Ouff
Sandnes, Norway
-
Member


Stefan Schöggl
Vienna, Wien, Austria
-
Member

.jpeg)
Jannes Kruse
Aachen, Nordrhein-Westfalen, Deutschland
-
Member

Brenna Robertson
-
Member


Tom Owen-Smith
Lambeth, London Borough of Lambeth, England, United Kingdom
Doughnut Economics is an inspirational text, and I am keen to be part of building it out to change our economy and society. I am the Sustainability lead at SUMS Consulting – we are a not-for-profit membership organisation providing consultancy services to the university sector, mostly in the UK. One aim is to make universities run sustainably and in harmony with their place. Universities are also at the centre of knowledge production and can make big contributions to the paradigm shift through their research, education and ability to bring people together. I hope to learn from this community and share ideas for change – both for my work and for living my own life.
-
Member


Mohak Gupta
New Delhi, Delhi, India
I am an urban development professional working on applying sustainability principles to the built environment with expertise in urban management and resource governance. With prior training in architecture, I have worked on diverse design and planning aspects including climate-responsive urban and rural habitat development, green building consultancy, vernacular and alternate building technologies, and built and cultural heritage conservation. My current work is centred around integrating concepts of resilience, resource efficiency, and circularity in sustainable development policy and planning paradigms, adopting a systems thinking perspective and an action research based approach towards development of inclusive green economies. I graduated in Urban Management and Development from Erasmus University, Netherlands as an Orange Knowledge Program Fellow and have previously studied Architecture at Sushant School of Art and Architecture, India.
-
Member

Astrid Lyssens
Budapest, Közép-Magyarország, Hungary

